

How I built a COVID-19 tracker using PHP
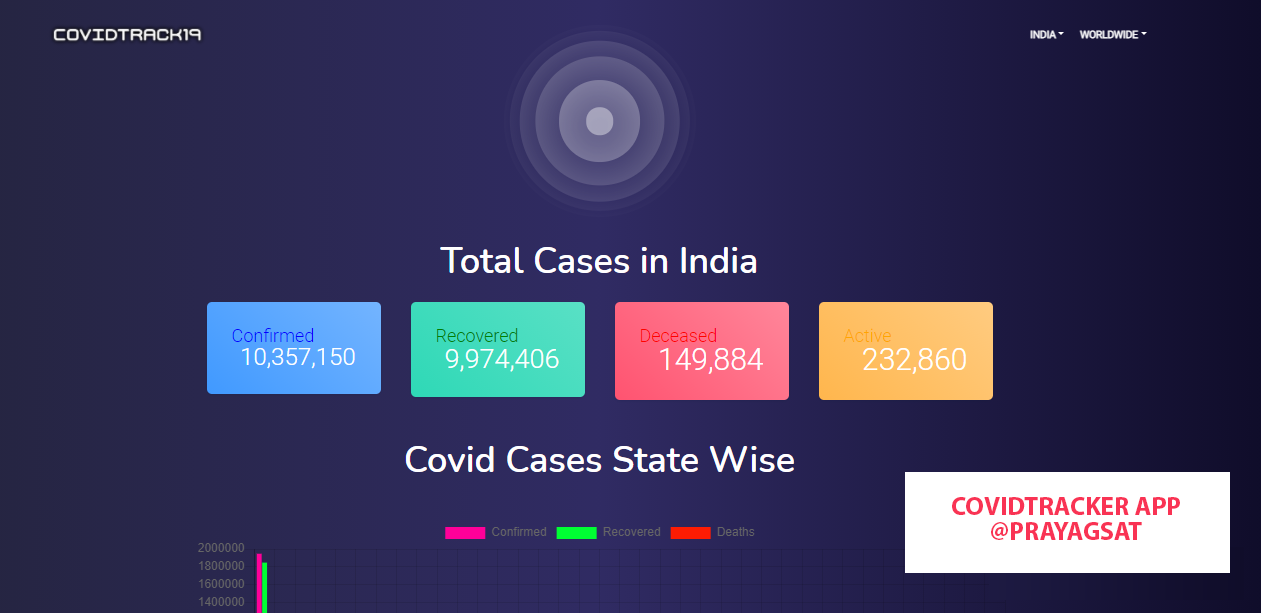
In this article, I’ll show you how I built a real-time COVID-19 tracking web application using PHP and Chart.js. This tutorial is aimed at anyone with a basic understanding of web development and a curious mind who wants to learn how data from an API can be transformed into an interactive web application.
CREATING THE MARKUP
HTML file
The HTML file just holds the basic HTML structure code for a webpage. The only thing added other than that is a canvas inside the body tag to visualize the result. The canvas is given an ID "myChart".
<body>
<table id="keywords table-responsive" cellspacing="0" cellpadding="0">
    <thead>
    </thead>
    <tbody id="myList">
      <canvas id="myChart"><p></p></canvas>
    </tbody>
  </table>
</body>
PHP file
I used an API from ** covidindiatracker ** for results from India and ** PomberAPI ** for worldwide real-time results. The COVID cases are fetched from the JSON file and stored in the variable jsonData. The jsonData is now a JSON-encoded object, and it has to be converted into a PHP object. Now let us look at the data returned by the JSON file. The object contains key-value pairs. confirmed, active, and recovered are the keys, and the number of cases for each are their corresponding values. The JSON-encoded object is now converted into a PHP object called datatot using json_decode() function in PHP. The datatot is now an array of key-value pairs.
covidindiatracker
<?php
	$jsonData= file_get_contents("https://api.covidindiatracker.com/state_data.json");
	$data= json_decode($jsonData, true);
?>
pomberapi
<?php

	$jsonData= file_get_contents("https://pomber.github.io/covid19/timeseries.json");
	$data= json_decode($jsonData, true);

	foreach ($data as $key => $value) {
		$days_count=count($value)-1;
		$days_count_prev=$days_count-1;
	}

	$total_confirmed=0;
	$total_recovered=0;
	$total_deaths=0;

	foreach($data as $key =>$value)
	{
		$total_confirmed=$total_confirmed+$value[$days_count]['confirmed'];
		$total_recovered=$total_recovered+$value[$days_count]['recovered'];
		$total_deaths=$total_deaths+$value[$days_count]['deaths'];

	}

?>
The required data is fetched using the key value. The keys are targeted because the API returns the data in key-value pairs. Similarly, the state-wise results are fetched from state_data.json file. Here, a foreach loop is used to iterate through each key/value pair in the data arrays to obtain the details of every state. We are done with the tabular data.
Chart.js
Now, we are using a popular lightweight data visualization library called Chart.js to visualize the data in the form of a line chart as well as a bar chart. First, we need to instantiate the chart class. To do this, we need to pass in the node jQuery instance, or 2d context of the canvas where we want to draw the chart.
The chart constructor has all the necessary configurations for the chart, like type: "bar" for bar chart type: "line" for line chart. The data object holds all the datasets, labels, and other related data. The datasets are an array of objects that hold the values and properties of how the data must appear on the canvas. Similarly, we can visualize data and represent it in visual form.
var myChart=document.getElementById("myChart").getContext('2d');

var chart= new Chart(myChart, {
	type:"bar",
	data:{
		labels:states,
		datasets:[
		{
			label:"Confirmed",
			data:confirmed,
			backgroundColor:"#FF0099",
			fontColor: 'white',
		},
		{
			label:"Recovered",
			data:recovered,
			backgroundColor:"#00FF33",
		},
		{
			label:"Deaths",
			data:deaths,
			backgroundColor:"#FD1C03",

		},
		]
	},
	options:{}
})
FINAL RESULT
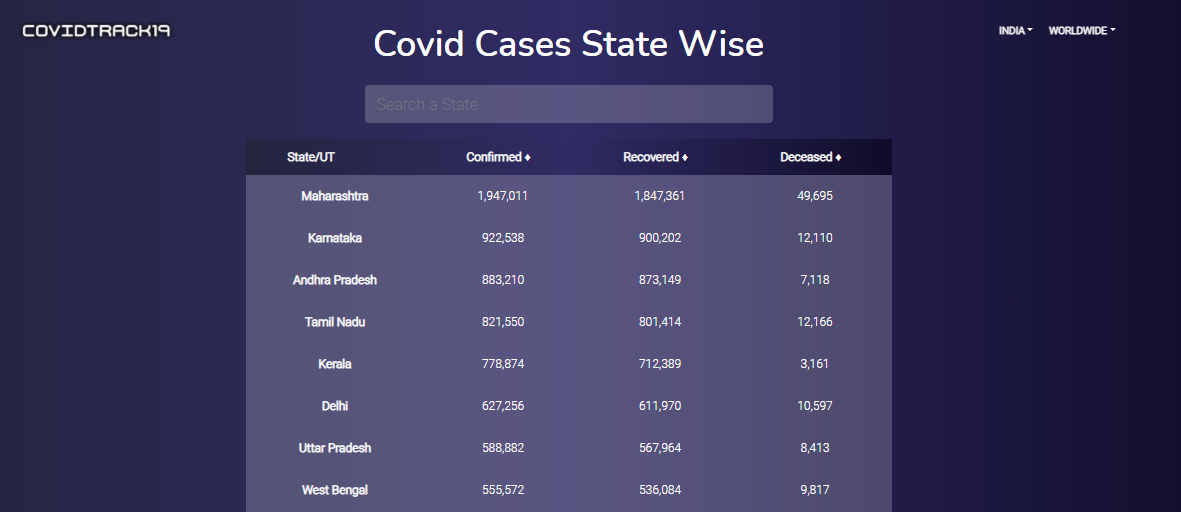
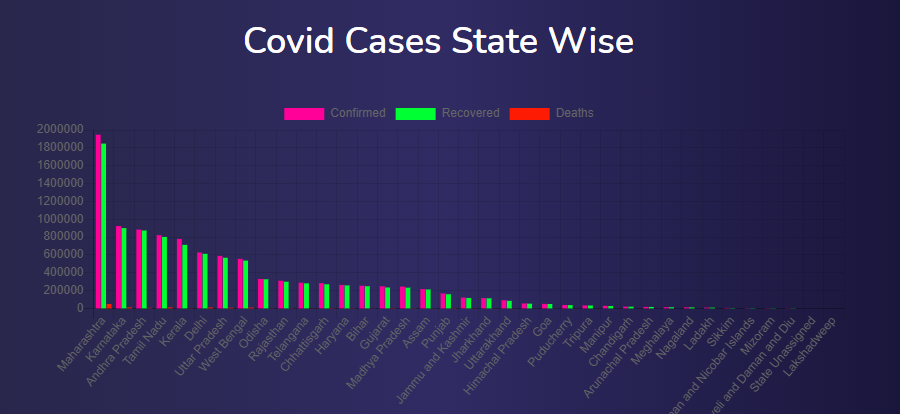
The source code for the project is available on my GitHub repository. Go through the code and try to build a COVID tracker on your own!.